A self-hosted dashboard for your sports and fitness data. Dreeve turns every workout into beautiful charts, deep insights and stats without handing anything over to a third party.
Formerly known as Statistics for Strava
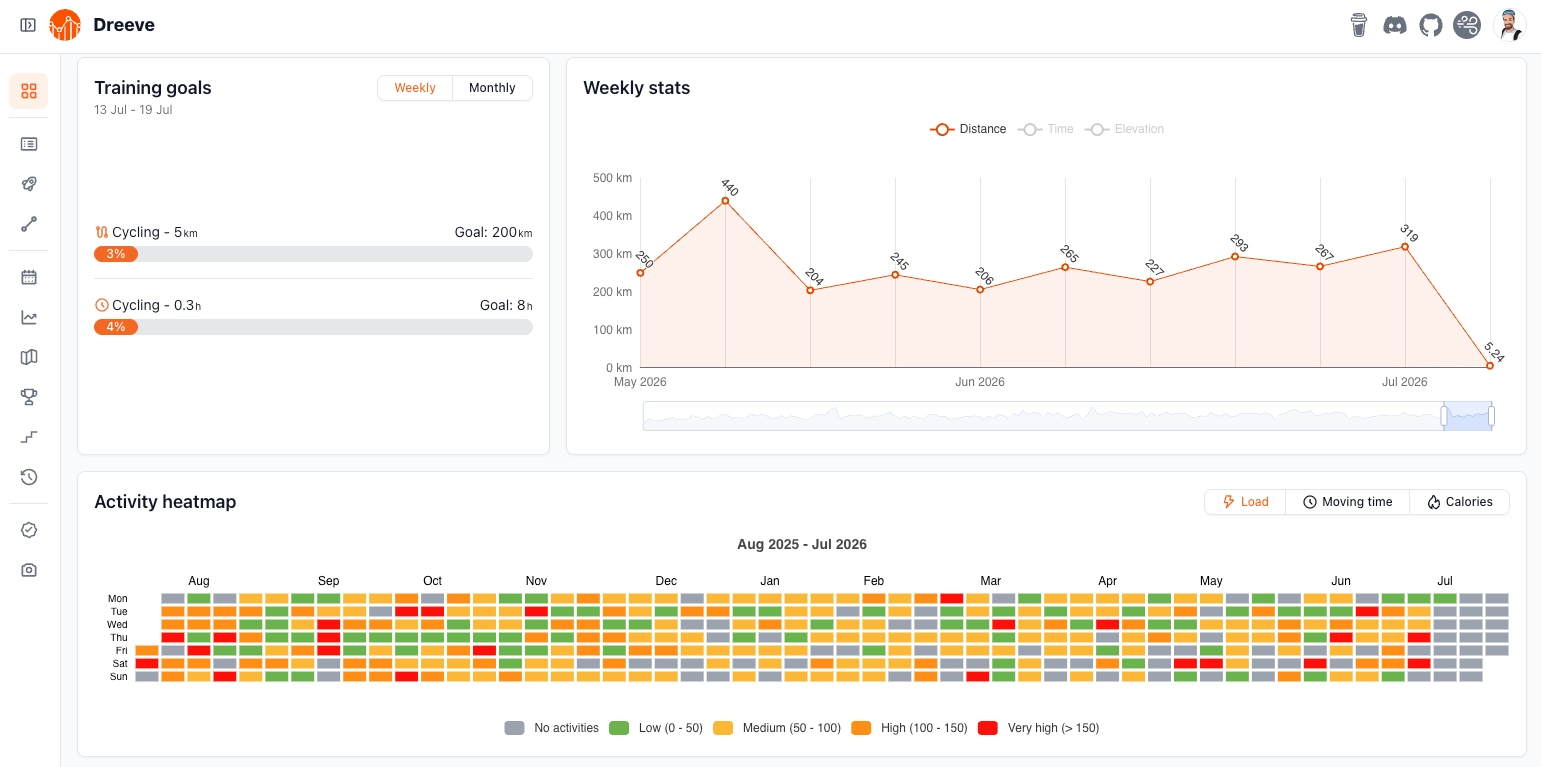
From a high-level dashboard down to per-segment splits, and everything in between.
Every stat, chart and trend at a glance.
Dive into your segment history, KOMs and personal bests with rich filtering.
A world map of every kilometre you've ever covered, anywhere you've been.
Your fastest 5k, 10k, 50k, 100k and beyond across every sport you do.
A timeline of your achievements, plus a yearly Rewind to look back on it all.
Browse all your activity photos in one place, organised by workout and date.
Interactive calendar with month-by-month totals, sport breakdowns and trends.
Track wear on every bike, shoe and component. Get reminded when service is due.
Personalised workout suggestions and insights powered by your own data.
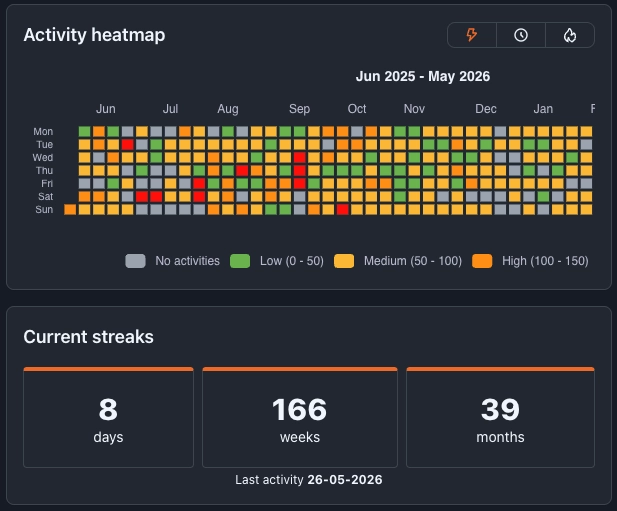
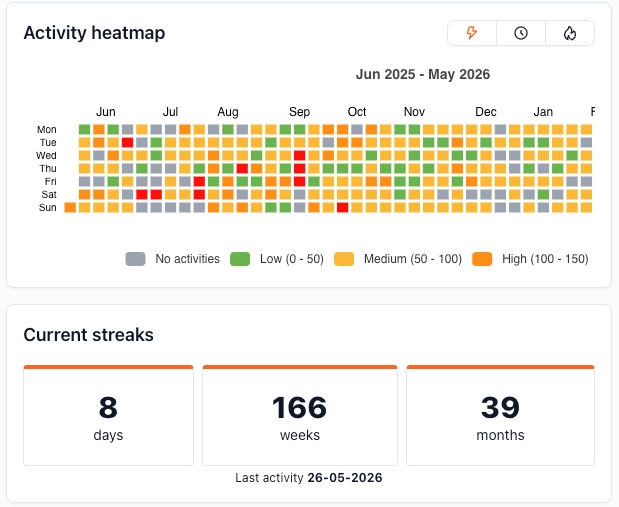
Drag the slider to compare light & dark
If you can run a Docker container, you can run Dreeve. Connect your account, hit go, and watch your years of data sync.
Also published to GitHub Container Registry
Built by people who ride, run, swim, lift and do every other kind of workout out there. If you've got ideas, bug reports, or just want to chat, GitHub and Discord are open.